
Yankee Group research may not be as well-subscribed as say, Gartner’s, but I like to think that it compares favorably with it. Earlier this year I wrote a research note titled Fear and Loathing in Las Vegas: the Hackers Turn Pro about the increasing number of vulnerabilities found in security products. The paper documents the flaws found over the last 18 months in a variety of security products, and give prescriptive guidance on what security product vendors and enterprise customers must do.
In the ’note, I made it clear that the mere act of finding security vulnerabilities implies neither malicious intent on the part of researchers, nor of the inevitability of attacks. That said, it is equally clear that there is a relationship between vulnerabilities discovered upstream by the research community and the mass-attacks that occur later downstream.
Put simply, what we are witnessing is the formation of a fully developed vulnerability supply chain. Raw materials (theoretical breaks) become intermediate products (proof of concept code) and are then assembled into finished goods (mass exploits).
| Supply Chain Stage | Actor | Product | Constraints |
|---|---|---|---|
| Raw materials | Vulnerability researcher | Published vulnerability | Time to reverse engineer, technical skill |
| Subcomponent assembly | Vulnerability researcher, “proof of concept” website | Public posting of POC | Vendor pressure |
| Finished goods | Script assembler | Scripted exploit | Time to write scripts |
| Distribution | Organized crime | Mass exploits | Time to add to botnet payloads |
It is often said by old hands in the security game that there is no “security by obscurity”; that in time, even the best-hidden protections will inevitably yield to the scrutiny of the curious and the determined. While that’s true, what proponents tend to miss is that little phrase in time. Time matters, because the time required to re-research and reverse-engineer someone else’s public vulnerability requires a non-zero amount of time. That’s time an organization can use profitably, to patch affected systems or implement alternative countermeasures.
Let’s look at a worked example, and see what conclusions we can draw about the “obscurity” argument. Below is the lineage and pedigree of a mass-exploit security vulnerability, namely the Veritas Backup Exec remote agent overflow (CAN-2005-0773).
| Date | Stage | Actor | Event |
|---|---|---|---|
| Unknown | Raw materials | Anonymous researcher | Vulnerability researcher discloses security flaw to aggregator iDefense |
| Jan 11, 2005 | Subcomponent assembly | Thor Doomen | Script assembler releases proof-of-concept code> on low-traffic website |
| Mar 16, 2005 | - | iDefense, researchers | Assembler and aggregator contact vendor |
| Mar 30, 2005 | - | iDefense, Veritas | Vendor responds and begins fixing product |
| Jun 21, 2005 | Advanced ship notice | FrSIRT | French exploit code publisher FrSIRT publishes POC code |
| Jun 22, 2005 | - | iDefense | Security aggregator publishes advisory as part of coordinated response with vendor |
| Jun 24, 2005 | Finished goods | Metasploit | Exploit plugin for the Metaslploit automated security assessment tool released as part of major release 2.3 |
| Jun 27, 2005 | Distribution | SANS ISC | Handler’s diary documents widespread reports of scans on port 1000 |
| Jun 29, 2005 | - | US CERT | US CERT releases security alert advisory* |
| Jul 2, 2005 | - | BleedingSnort | IDS portal BleedingSnort commits signature] for detecting exploit via Snort IDS |
There are several interesting observations about this chain of events. It appears that the author of a proof-of-concept exploit published his code publicly well in advance (5 months) of the broader vulnerability announcement in June. But it’s the incorporation of the code into the Metasploit attack_\h\h\h\h\h\h_ security assessment tool, two days later, that really kicked things into gear. According to the SANS Internet Storm Center, less than 48 hours later after the release of Metasploit 2.4, the number of scans on port 10000 spiked upwards by four orders of magnitude, to over 250,000 daily.
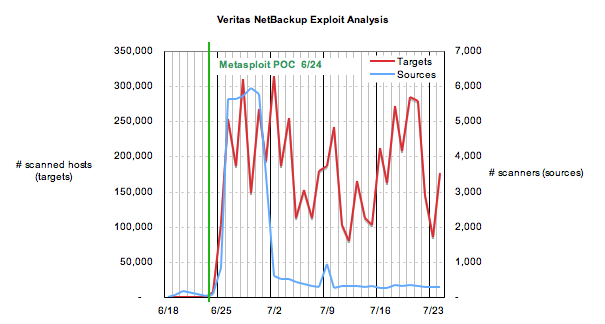
Source: SANS/Internet Storm Center
But that’s not all. The number of unique IP addresses that were the sources of the scans increased by several orders of magnitude also. The number of source machines were 88 hosts on 6/24, 836 on 6/25, and 5,636 on 6/26. On average, these machines scanned 81, 125 and 45 hosts. These are not the sort of simple scans that an administrator might do on his or her servers to verify a machine’s susceptibility to an attack. These are exploits. By way of comparison, the “normal” ratio of sources to targets earlier in the year was almost exactly 1:1.
Yes, you might be asking, but what about the proof-of-concept code circulated on Jan 11? Curiously, the number of target machines averaged about 49 before 1/11, then increased sharply to 254 on the day of posting. That number spiked to 7,882 on 1/14, then to 40,393 on 1/16 before settling back down more-or-less in the high dozens. That may sound like a bad thing, and it is, but the ratio of sources to targets stayed fairly low (1:1 or thereabouts) except on 1/16 (1000:1). The average ratio of sources to targets for the entire year up through 6/23 (the day before the Metasploit release) was 22:1, and the median was about 1:1 . (I haven’t bothered to graph the earlier data, because the data isn’t too interesting… the chart would appear as a big flat line, with a few irregular spikes on it.)
What do I conclude from all this? Not much, since this is just a single isolated example. But if somebody put a gun to my head and asked me to generalize from an n size of 1, I’d say four things:
- First, the data in this example puts the shaft to arguments made by these people and others, who passionately defend the right to post proof-of-concept code on their websites. POC code is clearly not being used primarily for diagnostic purposes or security assurance—it’s for attacking others.
- Second, obscurity works—sort of. The posting to milw0rm.com correlates well with an increase in scanning traffic, but the Metasploit release was followed by an order of magnitude more scans. In short, how and where POC code is posted affects attack trends. In particular, it appears that the vulnerability publication event itself might be a milestone event, and that POC code published in associated with it amplifies the effect. It begs an obvious question, which I’ll leave as an exercise to the reader—or Pete Lindstrom, if you prefer.
- Third, scripted attack tools play a catalytic role. It wasn’t until the POC was incorporated into a sort-of mainstream assessment tool that SANS and others observed significant numbers of scans on their sensors. If you make the assumption that self-assessing admins generate only 1:1 traffic, then you’d have to conclude that attack traffic comprised 95–99% of the scans done after POC release. Thus, automation is a powerful risk multiplier: in this case, 20ndash;100x.
- Fourth, the vulnerability supply chain’s later stages (finished goods and distribution) operate with tremendous efficiency. It’s not too dissimilar to the way Dell makes PCs; raw materials supply lines from Asia Pacific can stretch back for months, but final assembly in Round Rock takes just a few days.
The last thing I’d point out is that back-of-the envelope calculations are important, but they aren’t the whole story. We don’t know, for example, how long the exploit code was circulating prior to posting on milw0rm. We also don’t know from the data whether the criminal underground incorporated the Metasploit exploit into something wormable, or whether the scans came just from a stock Metasploit package. There’s a human backstory here that I’m not privy to.
Still, the data can tell us a lot.
Coda: my esteemed colleague Chris Wysopal reminded me of Bill Arbaugh’s excellent paper Windows of Vulnerability, published several years ago. That work is one of the best information security papers I have ever read, period, and it can rightly be said that this post is largely inspired by his previous work. All empirically-driven security researchers owe him, and Mssrs. Fithen and McHugh, a great deal for “showing how it’s done.” Thanks, Chris, for pointing this out.