
During a recent engagement, a large financial institution asked Markerbench to review and recommend changes to its Key Risk Indicators (KRIs) for cybersecurity. As background, our client’s first line of defense (1LOD) collects a series of cyber-related KRIs and presents them to senior stakeholders quarterly. The metrics program is well-organized and its monthly reporting packages are widely circulated.
In our 360-review of the cyber metrics reporting program, we encountered a common challenge: the first line’s KRIs were focused on controls, while the second line’s focused on risks. The mismatch between the two was jarring, and led to frustration. At the root of it was a misunderstanding of how senior leaders think about risk.
To use an analogy, when I’m asked what a CISO’s good day looks like, I reply that “it’s a day when nothing bad happens.” Picture a duck calmly moving across the surface of the tranquil pond. It might look effortless, but that picture of Zen is an illusion. You can’t see the duck furiously paddling under the surface of the water to stay afloat, avoid hazards, and move forward. The CISO’s peers and other higher-ups don’t want to hear about all of the paddling that CISOs do—the controls they’ve implemented, what’s covered and what isn’t, the godforsaken RCSAs, or blah-blah about “completeness.” To be clear, all of these topics are an important part of the CISO’s job.1 They just aren’t part of their peers’ jobs. Senior leaders want to hear about the risk climate: will it remain calm? Are we safe? Is the environment changing? Are we more exposed, and how might we know? What can we do about it? In short, when they want data, they want risk indicators, not control measurements. When risk indicators go south, of course, then—and only then—will senior leaders ask for additional data to help figure out why risks have increased, and who is responsible for fixing the underlying problem that manifested in the KRIs.
The language of risk
In order to have meaningful dialogue with senior stakeholders, then, we need to frame risks using the language of risk. That might sound obvious, but for many CISOs or their delegates, risk is—counterintuitively—a foreign tongue. Believe it or not, Chief Risk Officers and boards don’t talk about cyber risks using the classical InfoSec conjuring words of Confidentiality, Integrity, and Availability.2 Instead, they talk about financial and reputational risks, business risks, and operational risks. In other words, they want to know what is the likelihood that bad things will happen, and what they can do to avoid them.
The language of operational risk is how Chief Risk Officers talk about risk in large institutions. Operational risk refers to the collective set of hazards arising from a firm’s operations, which includes the prospect of fraud, non-compliance with regulatory obligations, legal exposure, poor processes, human errors, and technology issues. Logically enough, operational risk includes technology and cybersecurity risks.
Nearly every institution has its own risk taxonomy—a classification system for describing every conceivable type of operational risk. I have found that the Operational Risk Exchange (ORX)’s Reference Taxonomy for Operational and Non-Financial Risk offers a practical grammar for describing cyber and technology risks. The ORX taxonomy was developed by a consensus industry group of senior risk professionals, largely from insurers and financial institutions. The ORX taxonomy is derived from—and improves on—Basel II’s seven original risk categories, because it is cleaner, MECE (mutually exclusive, collectively exhaustive) and has the benefit of years of collaborative practitioner feedback.
The ORX’s taxonomy is multi-dimensional because it doesn’t ask practitioners to shoehorn risks into a single bucket. It also includes a grammar for describing a given risk’s causes and downstream effects, or “impacts” in ORX parlance. Practitioners describe risks using three dimensions:
- Risk event: the bad thing that happened, without the the “why” or “so-what”: software failed, a system was compromised, the execution of a client-related product or service failed, or an external actor committed fraud.
- Cause: why the bad thing happened: a third-party suffered a control failure (read: got ransome’d), a malicious external actor hacked them, or an employee made a mistake.
- Impact: the result of the bad thing happening: the firm suffered direct financial losses such as fines, penalties, and legal costs; incurred indirect financial losses such as disruption of client services or opportunity cost; or sustained non-financial impacts, such as litigation, reputation damage, or regulatory action.
Risk statements
The ORX taxonomy covers the entire universe of operational risk. Other than for strategic or financial risks, practitioners can use the ORX’s grammar to express nearly any risk they can imagine as a combination of causes, events, and impacts. Even better, practitioners can use the grammar to inspire concise but powerful risk statements that capture the risks simply. For example:
- An external threat actor exploits vulnerable software, resulting in a large system outage that disrupts client services
- A critical system exposes confidential client information due to misconfiguration, and results in fines from data protection regulators
- Inadequate training causes a failed system change and results in a network outage
Although the ORX reference taxonomy is fairly large—with about 130 different causes, risk events, and impacts—the practical subset of cyber- and technology-related causes, risk events, and impacts that CISOs and CIOs need to worry about is far smaller. The diagram below depicts the risks that, in my experience, are most salient.
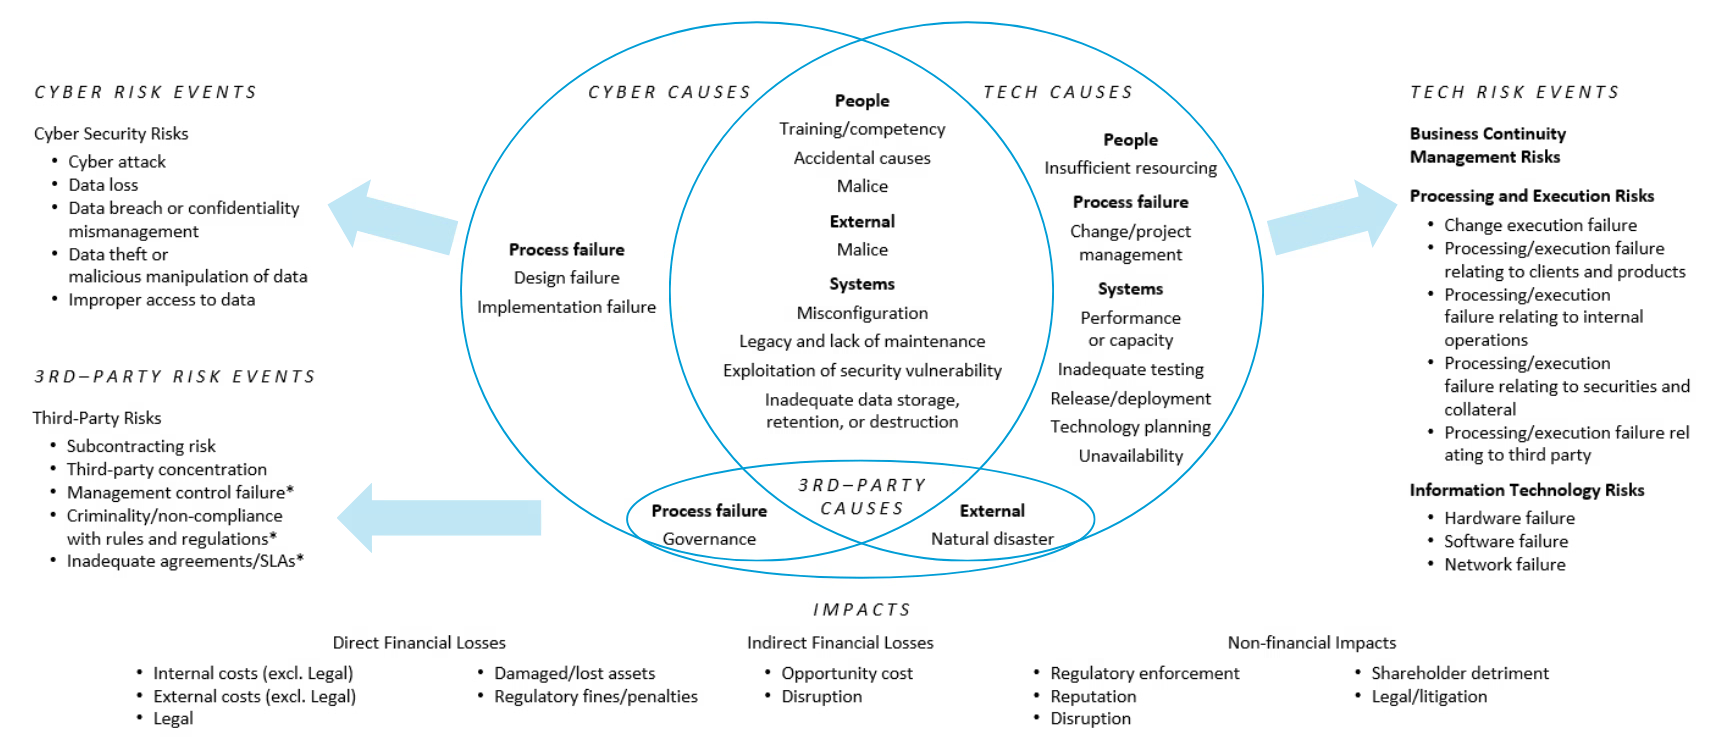
Primary Cyber and Technology Risks, based on the ORX Reference Taxonomy for Operational and Non-Financial Risk
Reading the diagram from middle and moving outward:
- Causes. The middle of the diagram shows a Venn of causes split between primarily technology-related causes (eg capacity planning, testing, change management) and primarily cyber-related causes (eg design and implementation failures), with a large subset that relate to both (eg external/malice, misconfigurations, accidental causes). Third-party related causes (process/governance failures and natural disasters) align to cyber and tech, respectively.
- Risk events. The left and right sides of the diagram depict the risk events: cyber risks such as cyberattacks, data loss, data theft, and improper access; third-party risks such as control failures; and technology related risks including business continuity events, processing and execution events, and lower-level component failures.
- Impacts. The bottom of the diagram shows the consequences of the risk events: direct financial costs, indirect financial costs, and non-financial impacts.
From a storytelling perspective, practitioners can use the grammar of causes, risk events, and (optionally) impacts to create risk statements, which need not be expressed using the literal taxonomy. But the dimensions should be easy to recognize with a little imagination. Here are a few practical examples of risk statements, along with their corresponding risk events, causes and impacts:
| Risk Statement | Risk Event | Cause | Impact |
|---|---|---|---|
| External fraud targeting employees who can authorize bank payments, resulting in stolen funds | External Fraud > First party fraud | External > Malice | Direct Financial Losses > Internal costs (excl. Legal) |
| Banking platform outage due to cyberattack on third-party, resulting in disruption to clients | Third-party > Control failure | External > Malice | Indirect Financial Losses > Disruption (customers) |
| Software failure caused by inadequate testing of planned changes, causing failure of internal system | Information Technology Risks > Software failure | Process failure > Change/project mismanagement | Indirect financial losses > Disruption (employees) |
| Large-scale infrastructure outage caused by compromise of administrative accounts (eg ransomware) | Information Security (including Cyber) > Cyber risk events | External > Malice | Disruption (employees) |
| Cyberattack on an unknown or believed-decommissioned asset, resulting in disruption to internal operations | Information Security (including Cyber) > Cyber risk events | Process failure > Governance failure | Disruption (employees) |
These examples show how to construct risk statements that describe cyber and technology scenarios. Each example contains twelve to fifteen words, which is a bit wordy. You can make them simpler by omitting the impact, which as a practical matter I tend to do. We can usefully speculate about the likely causes of a risk event because of loss histories or professional experiences, but we cannot know the impact of a hypothetical risk ahead of time. For example, the prototypical “small” cyberattack or systems outage has a habit of mushrooming into something larger. Therefore, the risk statement “Cyberattack on an unknown or believed-decommissioned asset” provides sufficient detail to enable us to picture the risk without worrying about what its impact might be.
How many risk statements are enough? In my experience, you can capture almost any organization’s salient risks in fifteen to twenty-five statements. This number is sufficient to identify the organization’s most pressing risks. These are the kinds of risks that keep managers up at night, represent a high percentage of notable incidents, or are otherwise notorious. For example, any long-tenured Goldman Sachs technologist can tell you about the August 2013 Incident, when a programming mistake mis-priced 16,000 options at $1 each and caused the bank to sustain a $38 million operational loss, garner a $7 million fine from the SEC, and fire the CIO. Using the ORX taxonomy, we might classify this risk event as a “Process/execution failure relating to securities and collateral,” caused by a “Systems failure related to inadequate testing,” and resulting in “Direct financial losses and regulatory fines.” Stating this simply, one might describe this risk generically as “Processing failure in core trading application due to inadequately tested code.”
You might not be able to unearth fifteen to twenty chestnuts as meaty as the August 2013 Incident. But you can almost certainly boil down the most common events, anecdotes, and concerns into a list of risks that will fit on a single page. That should be your target.
Visualizing risks
But wait, there’s more! With a bit of work, we can graphically depict the relationships between causes, events, and impacts. The Sankey diagram is a powerful way to show these relationships. Fans of Edward Tufte will recognize the exhibit format immediately: it shows flows between nodes, where the thickness of each edge relates to the strength of the connection, such as correlations or number of occurrences. Excel tools can’t create Sankey diagrams, but open source toolkits like D3, Plotly, and networkD3 can draw them for you using a few lines of code.
Sankey diagrams are ideal for analyzing risks retrospectively: which causes led to which risk events, and their downstream impacts. The diagram below shows a realistic—but made-up—dataset of risk events. Each row contains a cause, risk event, and impact. By analyzing the data as a whole, we can show the connections between them.
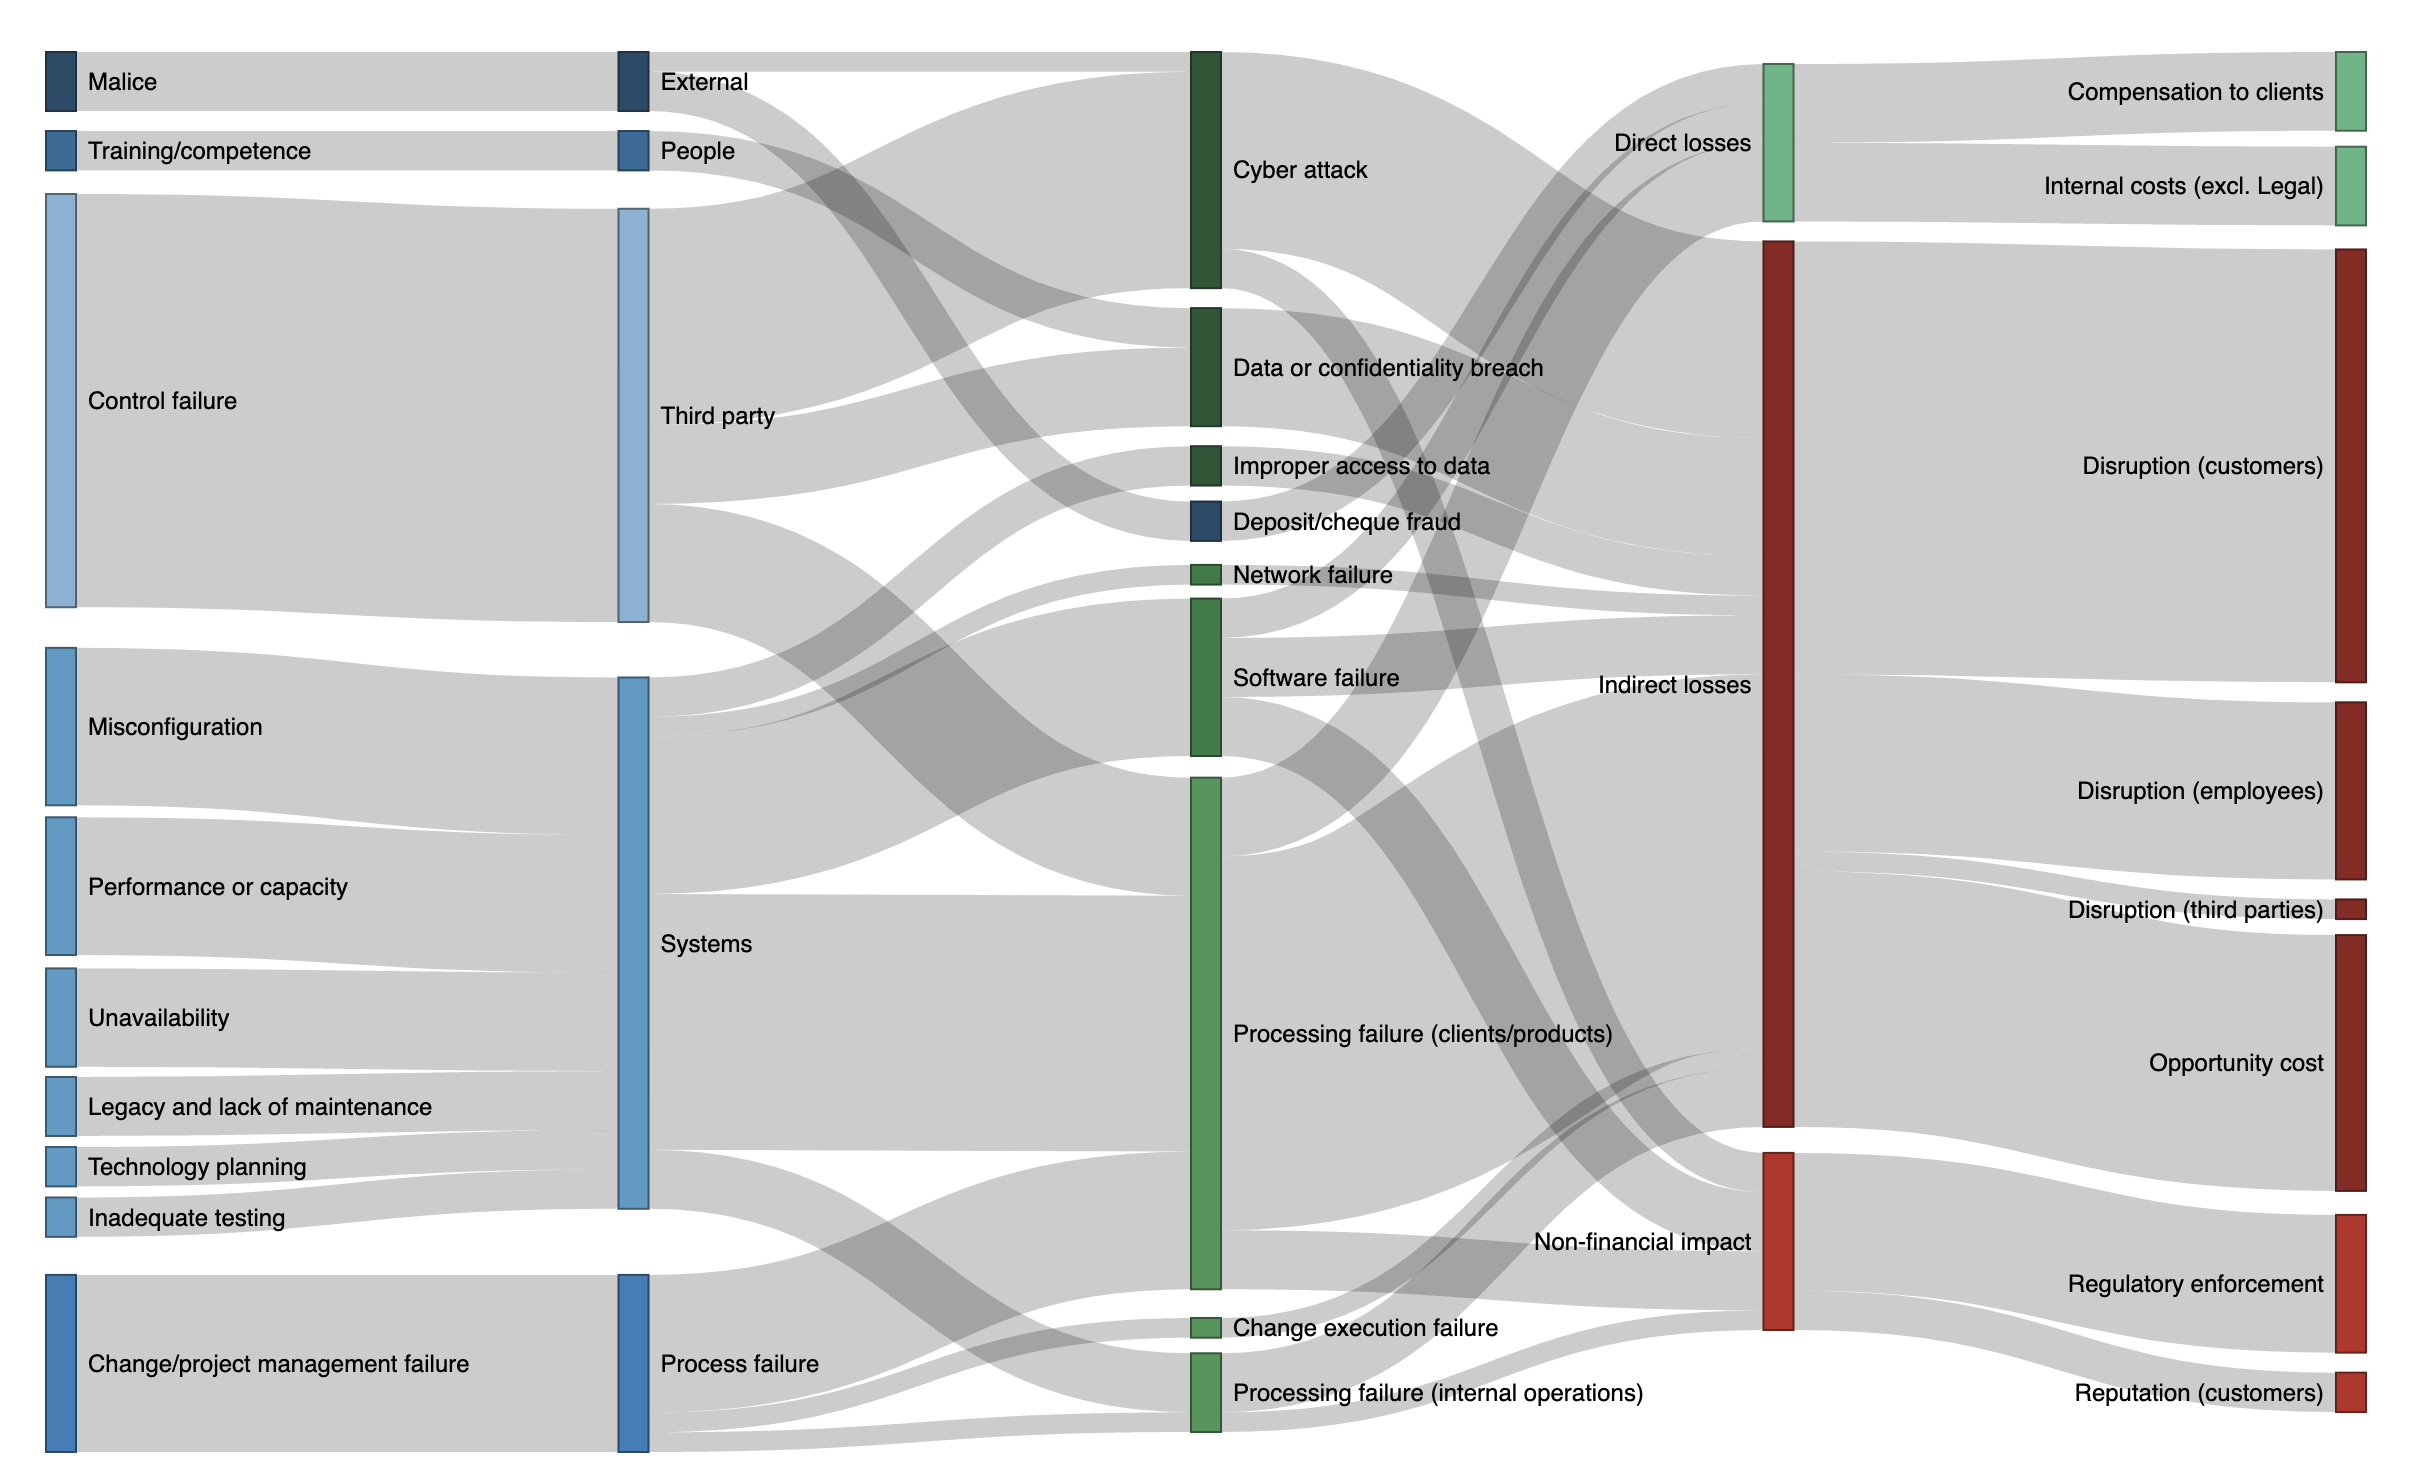
Sankey Diagram of Risk Events with their Causes and Impacts
The leftmost two nodes show the Level 2 and Level 1 causes (eg “Malice” and “External”). The middle nodes show the Level 2 risk events (eg “Cyber attack”). The rightmost two nodes show the Level 1 and Level 2 impacts (eg “Indirect losses” and “Opportunity cost”). For readability, I have simplified the labeling.3 In this fictional example, you can see that:
- Processing and execution failures relating to clients and products were the most frequently occurring risk event. Related risk events included processing interruptions to internal operations, change failures, and software failures. Most of these events resulted in disruption of services to customers and employees.
- Processing- and change-related failure events were caused primarily by systems and process deficiencies, notably misconfiguration, capacity issues, legacy assets, and lack of maintenance.
- Cyberattacks on third parties contributed significantly to processing failures and resulting disruptions to client services; however, many had limited or no impact (other than opportunity cost).
And indeed, if I were making the case to senior managers about which risks in this hypothetical example are most salient, I would show the diagram and tell the story exactly that way.
Wrapping up
This post was meant to give you a vocabulary and grammar for talking about risk using a standard risk taxonomy, the ORX Reference Taxonomy for Operational and Non-Financial Risk. By using a well-accepted taxonomy for risk, you can express complex technology and cyber scenarios in a simple way, without getting bogged down in the minutiae of control-speak.
In a future post, I will describe the next step: how to derive key risk indicators (KRIs) from risk statements by focusing on controllable causes and external environmental indicators.
Yes, even the godforsaken RSCAs. If you don’t know what an RCSA is, consider yourself lucky. ↩︎
The
holy trinitytraditional triad of information security (Confidentiality, Integrity, and Availability) are not risks. They are desired properties of high-assurance information security control environments. My friend John McCumber has expressed other desirable properties and information states in his famous Cube. Many practitioners are tempted to express risks as the lack of a desired property, eg “Loss of Confidentiality” or “Loss of Availability,” but this is rather thin gruel. The real risk in this type of thinking is, ahem, a “Loss of Nerve” by the practitioner. Naming a risk plainly is far better than inverting a property. And yes, in this context the term “InfoSec” was meant ironically. ↩︎Astute readers might wonder how I determined the node edge weights. For this example, I simply tallied the number of links between nodes (L2 causes → L1 causes, L1 causes → L2 risk events, L2 risk events → L1 impacts, L1 impacts → L2 impacts), in my fictional dataset. It would be more realistic to weight the impact links based on the magnitude of observed impacts. This would have the effect of boosting the events related to technology, because typical system outages are generally far costlier than cyber events. Of course, cyber events typically have fat tails: lots of lost laptops and low-level infections that cost nearly nothing, and a few rare events that swamp everything else. That said, because it is difficult to credibly model hypothetical impacts (which I cover extensively in my book), I recommend using Sankey diagrams for retrospective analysis and not for prospective modeling. ↩︎